[2023-11-02]
I recently found a pair of Fishinos and a few temperature/humidity sensors at home with no use. I had also built a basic air quality DIY kit from Airgradient a few weeks ago.
I coded their firmwares in a way to serve a JSON to be plotted somewhere in my homelab. First I tried a fancy setup using Telegraf + Influxdb + Graphana. It worked, but I found it a bit overkill for this purpose. Sources of this attempt are published here.
Then I went back to rrdtool, this old tool that I like so much. Virtually no layers, full control. The whole thing could fit into a single tiny Python script. Including database creation, fetching JSON, rrd populating and plotting!
This is a work in progress and sources are here. I intend to extend the experiment to other sensors and microcontrollers which are lying around, but I have really no idea where this is going.
[UPDATE 2024-01-27]
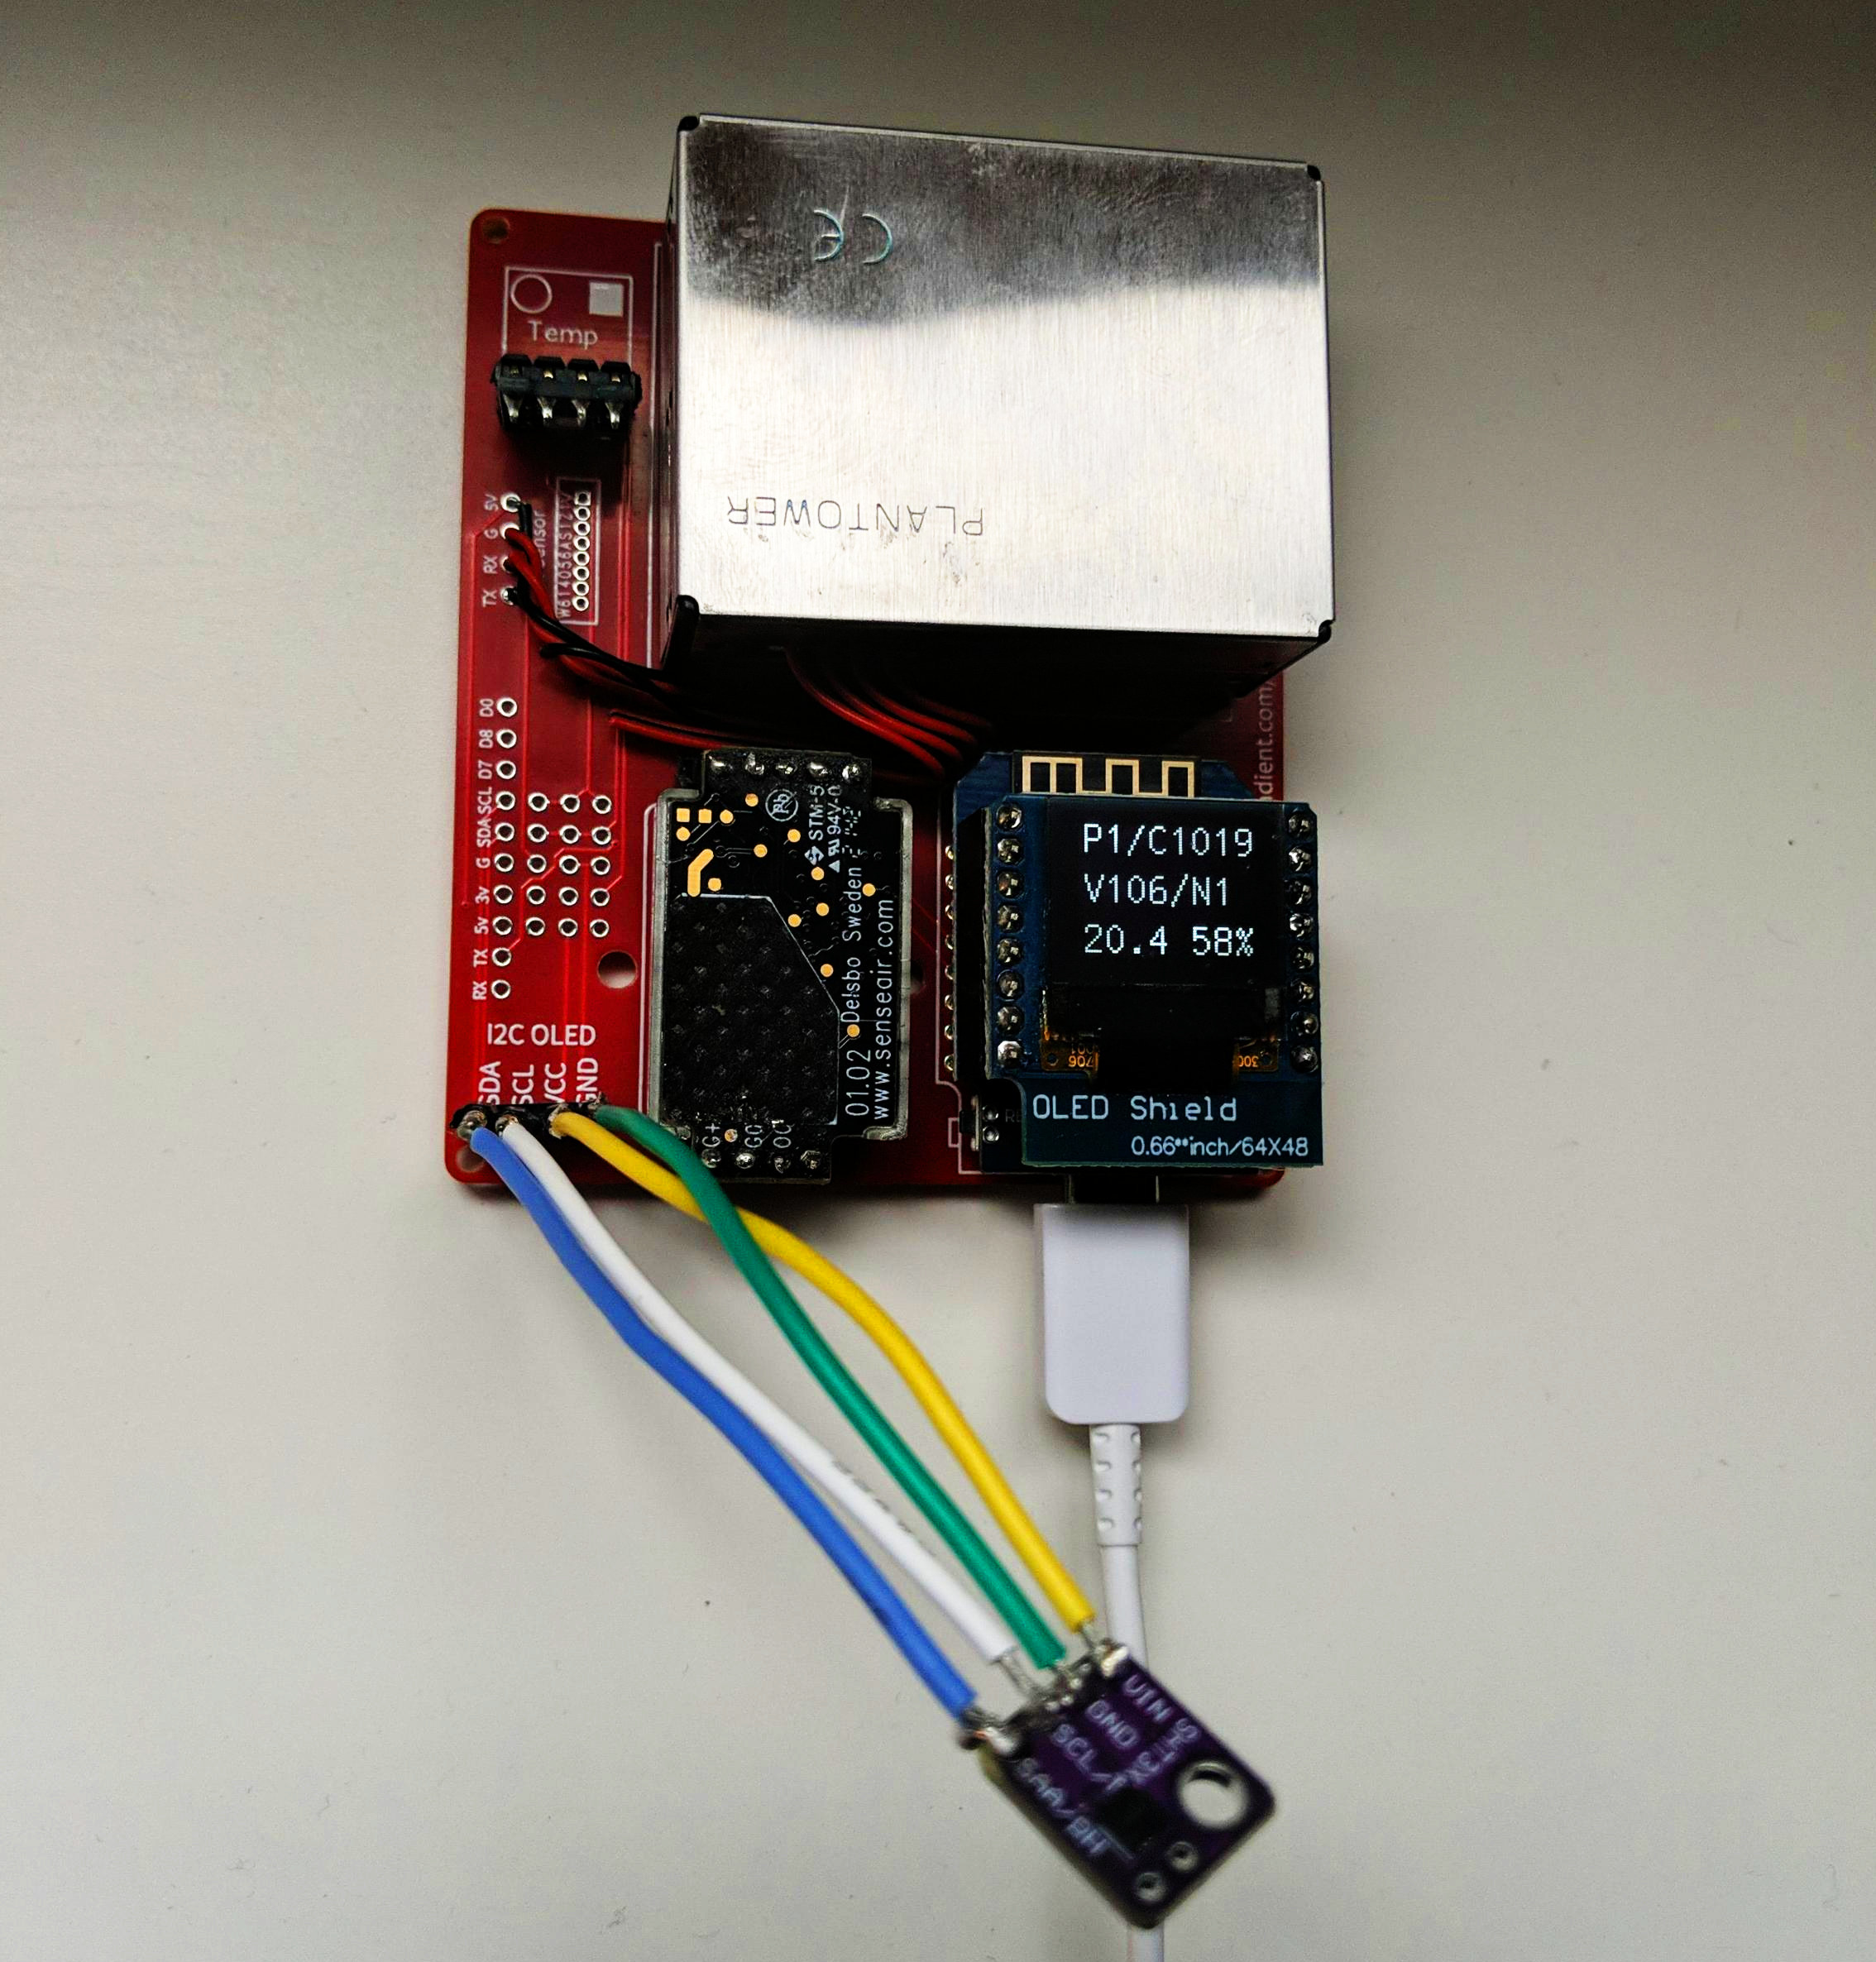
I added a SGP-41 VOC/NOx sensor to the Airgradient setup and reset the graphs. Together with the SHT-30, this one connects via I2C to the board so that they can be used simultaneously, given this specific module from AG does not contain pull-up resistors.
I thought I could easily connect it to the spare I2C OLED pins in the board, but the VCC and GND pins are reversed. What I did was connecting the SGP-41 to the original SHT-30 headers, and then I wired the SHT-30 using the OLED pins. There will certainly be more elegant ways to address that :-)
On the software side, two extra libraries are required: the Sensirion I2C SGP41 and the Sensirion Gas Index Algorithm. I’ve integrated both to the code, as well a HTTP server for the rrd pulling, and also did a few changes to display the values in the OLED module.
Graphs
The following graphs are (hopefully) being generated right now from sensors located somewhere in the Montreal area.
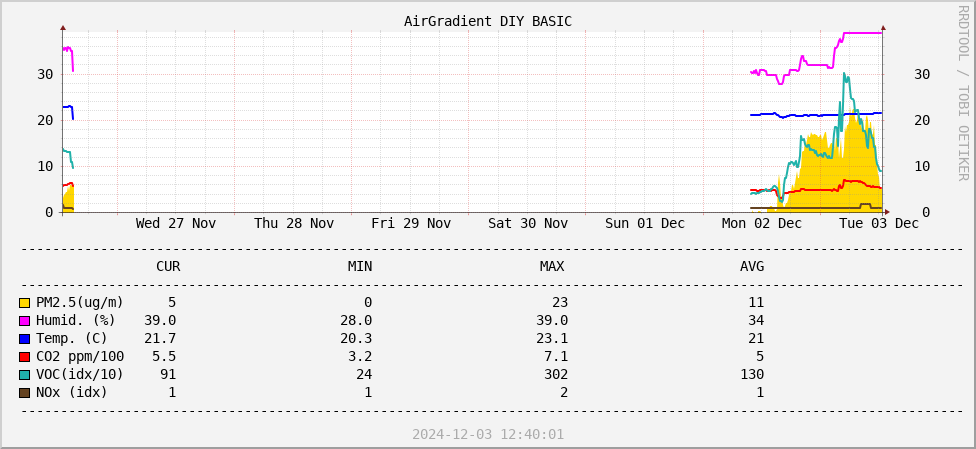
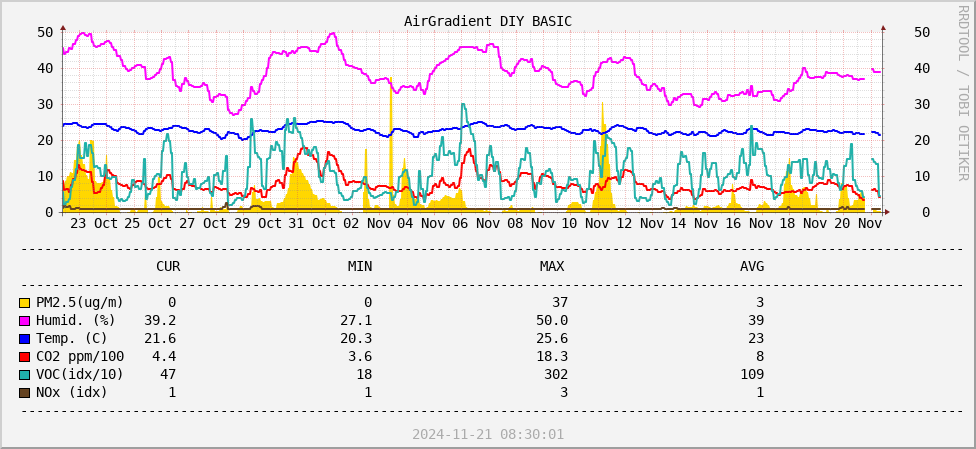
Temperature, Humidity, PM2.5, CO2 - Airgradient


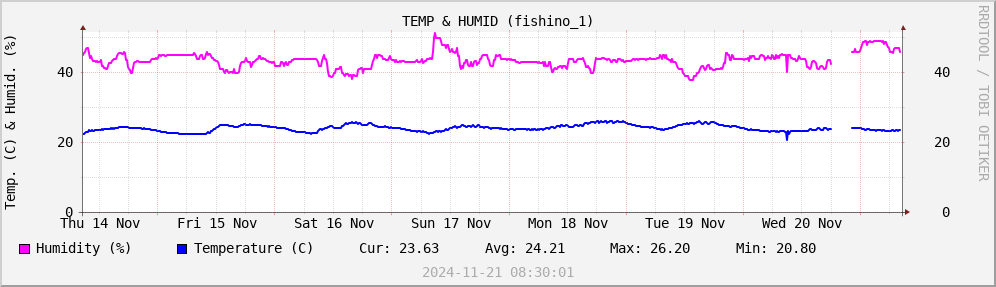
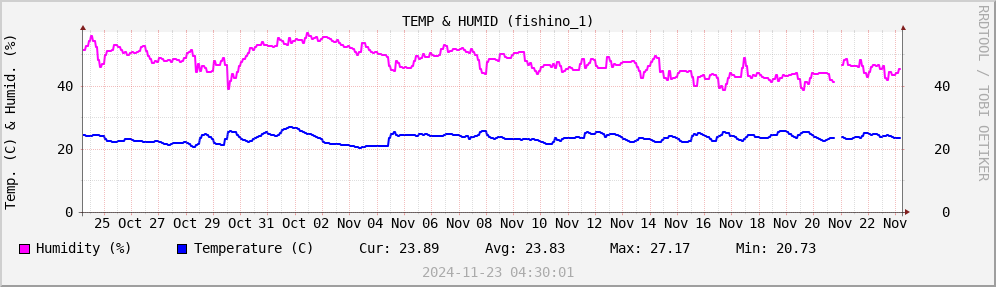
Temperature, Humidity - Fishino 1


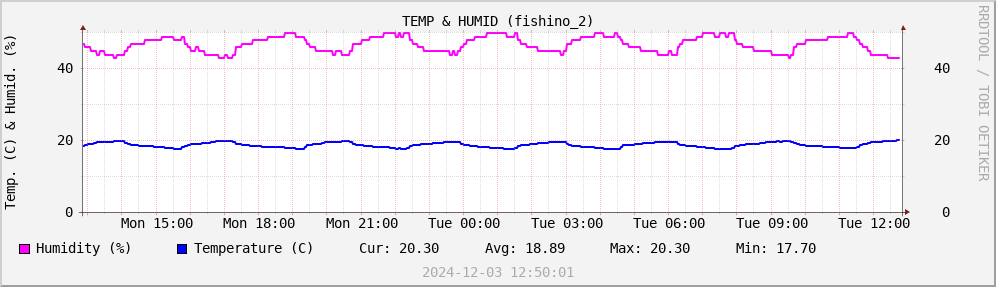
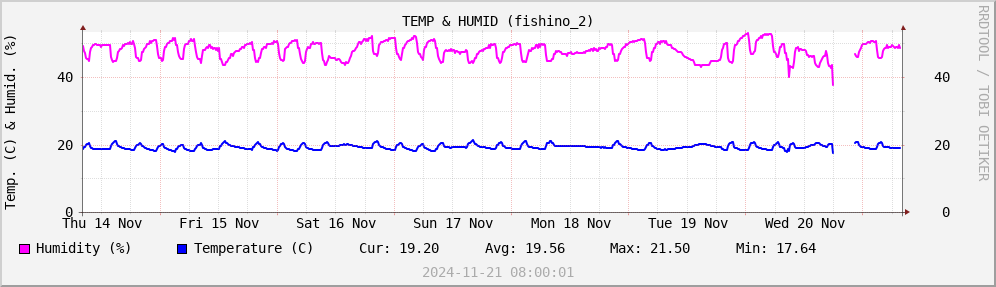
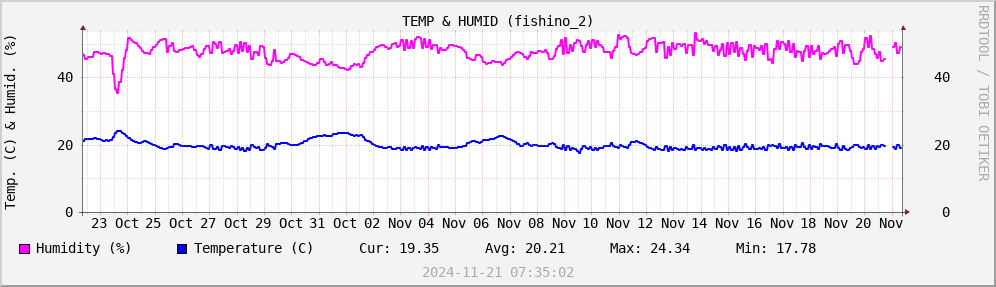
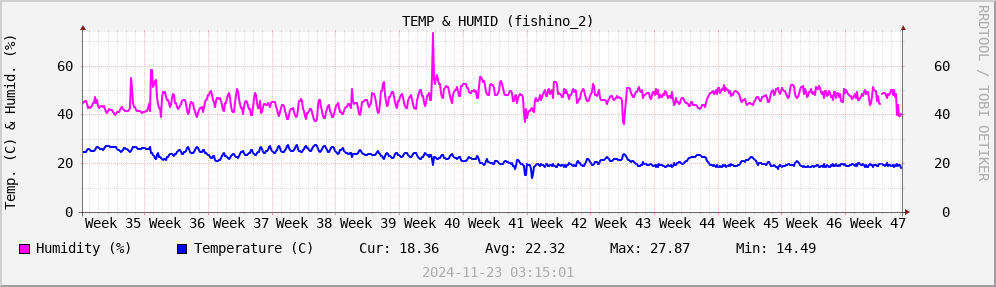
Temperature, Humidity - Fishino 2